Game 1 vs. Maryland: 17-26, 65.4%, 4 TD, 0 INT
Analysis: This is where many people began to believe in Kevin. One of the most impressive quarterback performances since Aaron Rodgers, Riley was nearly perfect against the Terps. Maryland did end up being awful, but still it was a great performance from Riley. Nothing more could be asked from.

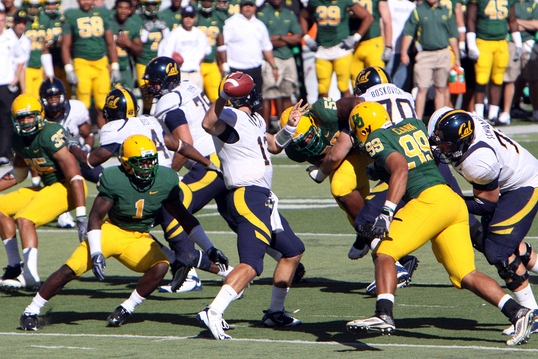
Riley was good against Maryland, and not just at handing it off.
Game 2 vs. Eastern Washington: 13-20, 148 yards, 65%, 1 TD, 0 INT
Analysis: This game could be thrown out just based on the competition, but still a very good game from Riley. Completed 65% of his passes again, didn’t play the whole game due to it being Eastern Washington.

"So easy, a caveman could do it!"
Game 3 at Minnesota: 16-25, 252 yards, 64%, 0 TD, 0 INT
Analysis: Again, a great performance from Kevin. Didn’t have to win the game with Best running for 4 TD, so he just completed the great majority of the passes and kept the ball moving.

Other than this, Good Riley!
Game 4 at Oregon: 12-31, 123 yards, 38.7%, 0 TD, 0 INT
Analysis: Let’s never discuss this game. Truly a terrible, no good, awful performance. Low yardage, low completion percentage, low quality.
A familiar sight; Riley pressured, offensive line collapse.
Game 5: vs. USC: 15-40, 199 yards, 37.5%, 0 TD, 1 INT
Analysis: Back to back performances of this quality, as Riley missed wide wide open receivers and threw an interception inside the red zone that helped break the Bears back. Same thing from above goes here.

Painful.
Game 6 at UCLA: 14-23, 205 yards, 60.9%, 3 TD, 0 INT
Analysis: Good Riley came back here. He spent most of the day watching Jahvid Best and Shane Vereen run all over UCLA, but when he did throw he was efficient. Found Marvin Jones several times deep and played perhaps his best game of the year to this date.
Run Kevin Run!
Game 7 vs. Washington State: 12-18, 229 yards, 66.7%, 3 TD, 1 INTAnalysis: Sure, it looks great on the stat sheet, but it was Wazzu. Still, can’t discount his very good numbers even if they were against WSU.

Nice stache.
Game 8 at Arizona State: 27-44, 351 yards, 61.4%, 2 TD, 0 INT
Analysis: This was one of my favorite games of the year. Riley was absolutely terrific, leading the Bears down the field for a game winning drive against a very tough and talented defense. When Best and Vereen were shut down, Riley stepped up and took the slack.
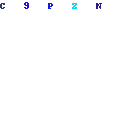
Calm. Cool. Collected.
Game 9 vs. Oregon State: 19-34, 200 yards, 55.9%, 1 TD, 1 INT
Analysis: Awful game. Not from Riley alone, but overall. The offensive line was complete and utter garbage, our running back almost got killed, and our defense was ripped to shreds. The stats look okay, but he did rack up a touchdown in garbage time.

Describes that whole awful game well.
Game 10 vs. Arizona: 13-22, 181 yards, 59.1%, 1 TD, 2 INT
Analysis: An okay game. Shane Vereen and the defense carried the team, but Riley did a serviceable job too. Nothing special, and he did toss the 2 picks, but he did alright.

He's like Vick!
Game 11 at Stanford: 17-31, 235 yards, 54.8%, 1 TD, 1 INT
Analysis: It’s funny; I remember Riley playing a lot better this game, but his stats look mediocre. While Vereen carried the team, Riley was on in the second half and made plays when he had too. I put this in the “Good Riley” category.

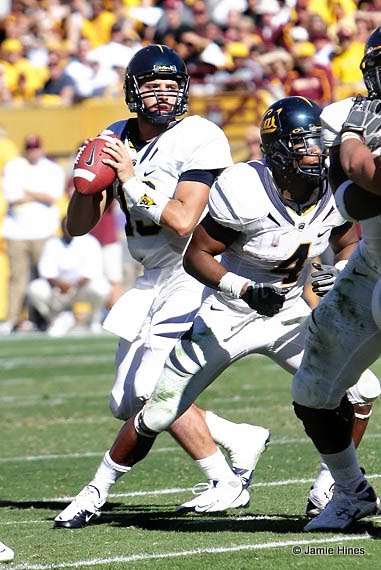
The aftermath: shirtless dudes.
Game 12 at Washington: 14-32, 215 yards, 43.8%, 1 TD, 0 INT
Analysis: I missed this game, so I’ll let the stats speak for themselves.
Game 13 vs. Utah: 20-36, 214 yards, 55.6%, 1 TD, 2 INT
Analysis: I missed a large chunk of this game, but looking at the numbers I stick this in “Okay Riley”. Our defense was pretty bad in this one, and Riley put together his prototypical “Okay Riley” showing.

Bleh.
So now we crunch the numbers. Using Phil Steele’s pass defense rankings (which weigh both numbers and strength of competition), here’s how Riley did against the various ranges:
1-10: 20-36, 214 yards, 55.6%, 1 TD, 2 INT. 1 game; Utah.
11-20: 42-84, 550 yards, 50%, 2 TD, 1 INT. 2 games: USC, ASU.
21-30: 12-31, 123 yards, 38.7%, 0 TD, 0 INT. 1 game: Oregon.
31-40: 27-45, 386 yards, 60%, 4 TD, 2 INT. 2 games: Arizona, UCLA
41-50: N/A.
51-60: 16-25, 252 yards, 64%, 0 TD, 0 INT. 1 game: Minnesota
61-70: 19-34, 200 yards, 55.9%, 1 TD, 1 INT. 1 game: OSU.
71-80: N/A.
81-90: N/A
91-100: 48-89, 748 yards, 53.9%, 6 TD, 1 INT. 3 games: Washington, Stanford, Maryland
101-110: 12-18, 229 yards, 66.7%, 3 TD, 1 INT. 1 game: Washington State
111-120: N/A
Overall, there’s not too much to discern from the quality of opponent. While he does do worse against better competition, the difference between 91-100 and 11-20 is not big enough to say, “OMG PLAYING AGAINST GOOD TEAMS RILEY IS AWFUL.” Sure, he is worse, but who gets better against the best secondary’s?
And for our finally stat, here’s the good Riley to Okay Riley to Bad Riley numbers:
Good Riley’s: 6 (Maryland, Minnesota, Eastern Washington, Washington State, Arizona State, UCLA; Stanford not included due to stats)
Okay Riley’s: 3 (Stanford, Arizona, Utah)
Bad Riley’s: 3 (USC, Oregon, Oregon State)
What to discern from these stats: Good Riley was around 50%, a solid or better Riley was around 75% of the time, and awful Riley was around 25% of the time. In order for Riley to have a successful senior season, Bad Riley needs to be eliminated. Good Riley needs to be around for at least 9 games, if not more, and okay Riley (and the okay Riley of Stanford more than Arizona/Utah) needs to be around every time the good one isn’t. A USC or Oregon performance and the season could be a failure after one game.
One stat to close: Nevada Pass Rank: 117, Colorado Pass Rank: 53. Those are the new opponents for this season.
Oh yeah, and if you missed the post before (cause it is the same day and all), it can be found below or here. Go Kevin Riley!

No comments:
Post a Comment